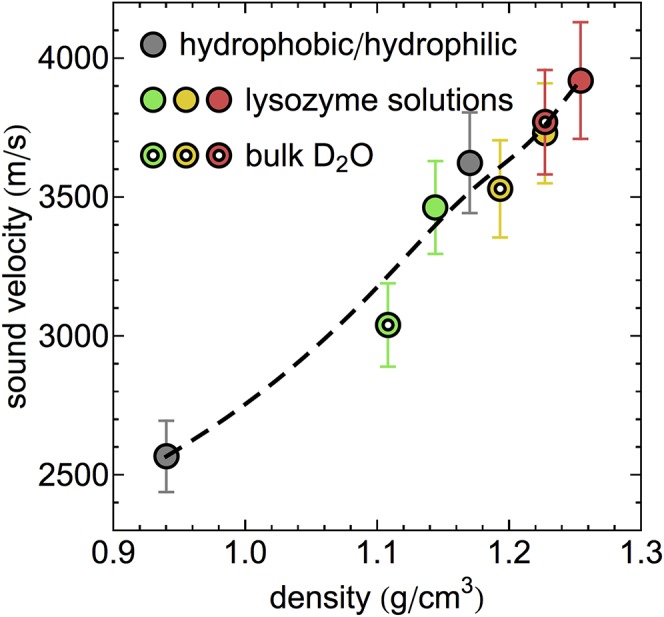
Fig. 3.

Density dependence of the sound velocity of D2O and lysozyme solution at various pressures. Data obtained for solutions containing large concentrations of hydrophilic and hydrophobic biointerface are shown according to ref. 52. Colors indicate the distinct pressures equivalent to Fig. 2. The dashed line serves as a guide to the eye.
