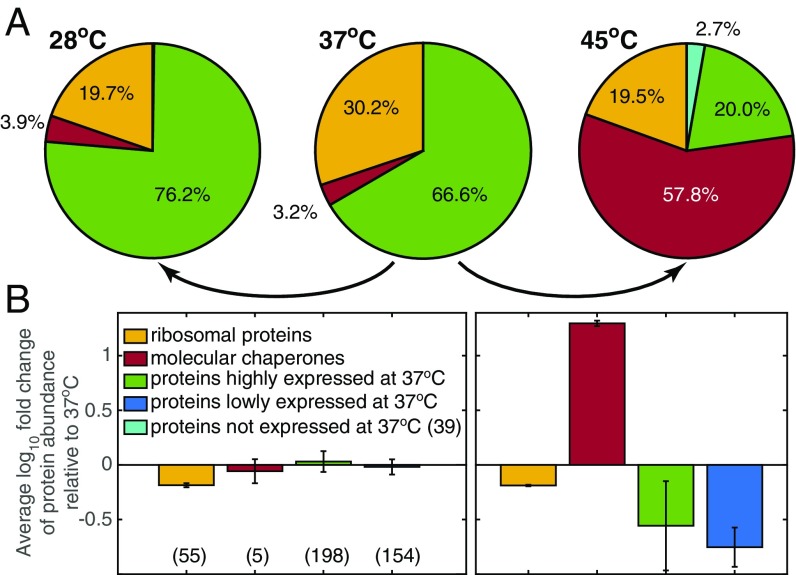
Fig. 2.
Proteome reallocation with change in temperature. (A) Pie charts of the computed mass fraction for ribosomal proteins (yellow); molecular chaperones (red); and proteins that are highly expressed (green), lowly expressed (blue), and not expressed (cyan) at 37 °C. Percentage is calculated with respect to all expressed proteins in FoldME (454, 446, and 448 at 28 °C, 37 °C, and 45 °C, respectively). (B) The average fold change in protein abundance at 28 °C (Left) and 45 °C (Right) with respect to 37 °C. The number of expressed proteins used for fold change calculation is shown in parentheses for each colored category. The error bars indicate variation of fold change in the particular protein fraction shown.

