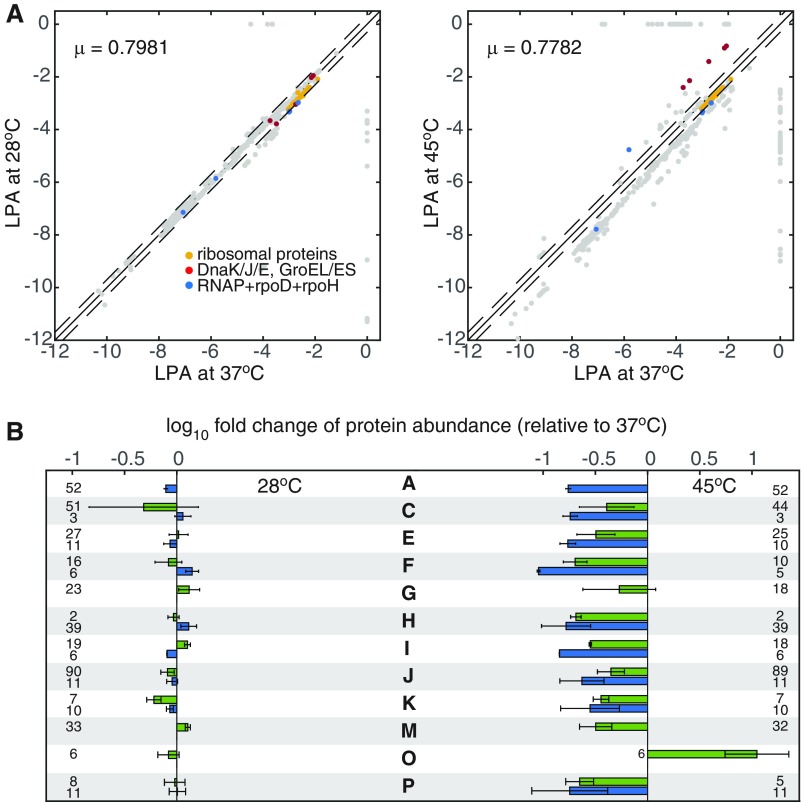
Fig. S2.
Comparison of the computed differential gene expression at 28 °C and 45 °C. (A) Logarithm of the protein abundance (LPA) at 28 °C and 45 °C is compared with LPA at 37 °C. LPAs of the ribosomal proteins (yellow), molecular chaperones (red), and RNA polymerase complex (blue) are highlighted for reference. (B) Average fold change of protein abundance in each main COG. For easy comparison with Fig. 2 in the main text, proteins in each COG category are grouped into those that are highly expressed at 37 °C (green) and those that are lowly expressed at 37 °C (blue). Numbers of proteins in every group are indicated in the same row. Error bars represent the SD of fold change within each protein group. COG categories are listed as follows: A, RNA processing and modification; C, energy production and conversion; E, amino acid metabolism and transport; F, nucleotide metabolism and transport; G, carbohydrate metabolism and transport; H coenzyme metabolism; I, lipid metabolism; J, translation; K, transcription; M, cell wall/membrane/envelope biogenesis; O, protein turnover and chaperone functions; and P, inorganic ion transport and metabolism.

