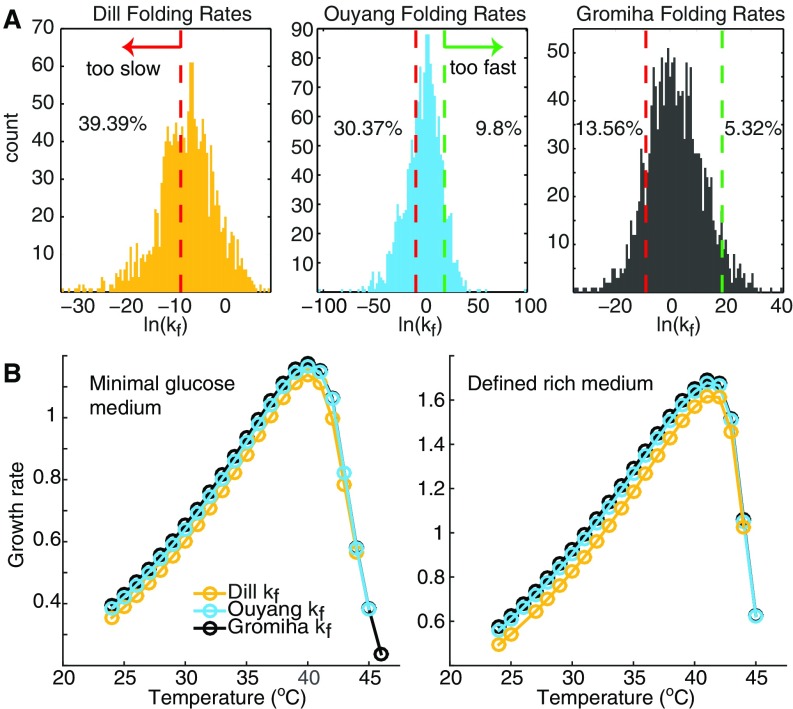
Fig. S8.
Kinetic folding rate distributions and their effect on growth rate. (A) Distribution of the kinetic folding rate for all proteins in the model, predicted using the Dill method (yellow), the Ouyang method (cyan), and the Gromiha method (gray), respectively. (B) Predicted temperature-dependent growth rate follows the same trend using the three formulations for kinetic folding rate calculation, respectively. Absolute values of the growth rate differ only by a small amount despite the orders of magnitude difference in the predicted kinetic folding rate.

