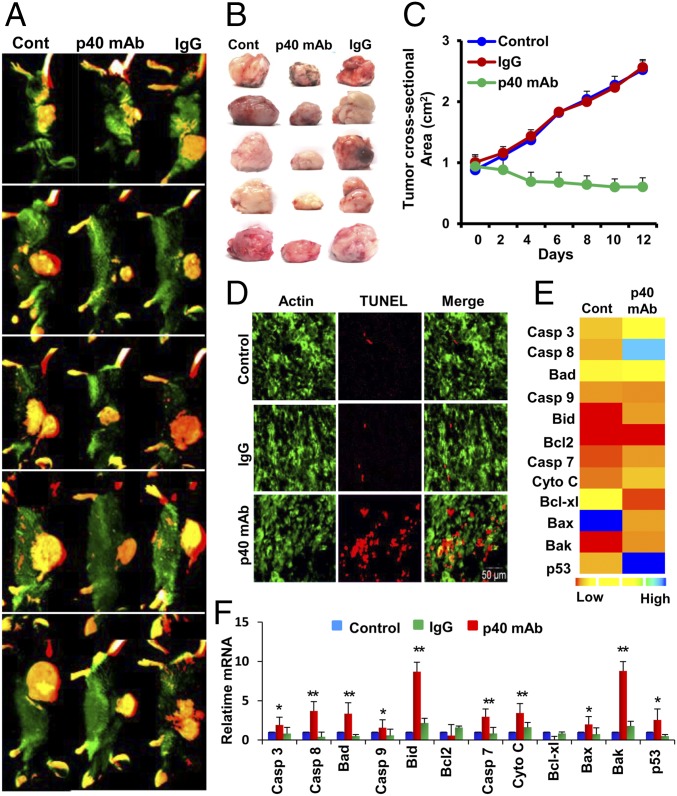
Fig. 3.
Regression of TRAMP tumor in vivo in mice by p40 mAb. (A) Eight- to 10-wk-old male C57BL/6 mice (n = 5 per group) were injected s.c. with a suspension of 1 million TRAMP-C2 cells. After approximately 6 wk, when tumors were 0.8–1 mm in size, mice were treated with p40 mAb (Middle) and hamster IgG (Right) at a dose of 2 mg/kg body weight twice per week. After 2 wk, tumors were labeled with Alexa 800-conjugated 2-deoxy-d-glucose dye via tail vein injection and then imaged in a LI-COR Odyssey IR imaging system. Results were compared with the control group (Left). (B) Tumors were excised from the flank of all groups of mice. Five mice were included in each group. (C) Tumor size was monitored every alternate day. Results are mean ± SEM of five different mice. (D) TUNEL assay in control, IgG, and p40 mAb-treated tumors (green, β-actin; red, TUNEL). (E) Custom mRNA array for 12 different apoptotic genes in control and p40 mAb-treated group, which was then plotted with Heat Map Explorer software. (F) Real-time mRNA analyses of 12 apoptotic genes. Results are mean ± SEM of five mice (*P < 0.05 vs. control and **P < 0.01 vs. control).

