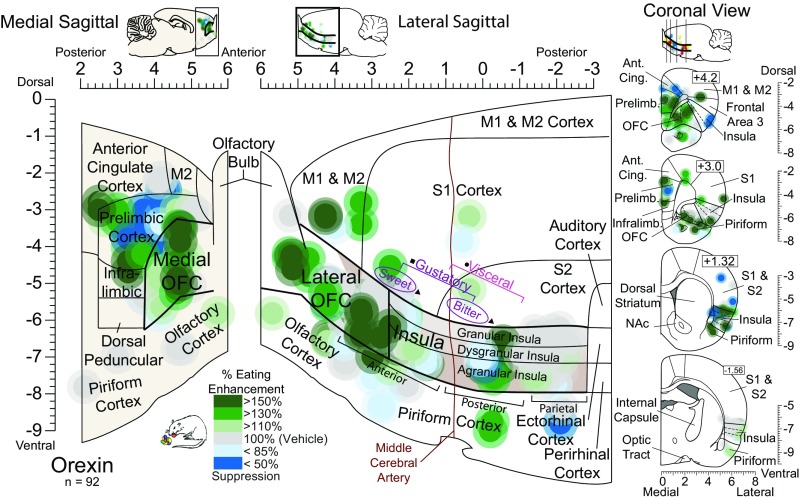
Fig. 8.
Orexin stimulation in the OFC increases food intake. Functional maps show increases (green) or decreases (blue) in palatable food intake caused by orexin microinjections in cortical sites. Symbols are as in Fig. 7. The color reflects the percent change in the consumption of M&Ms induced by the orexin microinjection compared with vehicle control levels in the same rat. Orexin microinjections in all OFC regions increased food intake by 150% over vehicle control levels [χ2 = 6.632, P = 0.036; Z = −2.175, P = 0.030, r = 0.50, CI (0.7, 2.7)], as well as in a few medial prefrontal sites in the anterior cingulate and infralimbic cortex. No consistent increase was observed after orexin microinjections in any region of the insula (χ2 = 2.78, P = 0.249; χ2 = 2.516, P = 0.284). Likewise, no intake increase was observed after orexin microinjections at sites in the piriform cortex (Z = 0.471, P = 0.637), ventromedial PFC (χ2 = 0.187, P = 0.911), olfactory cortex (χ2 = 2.80, P = 0.247), or motor/somatosensory cortex (χ2 = 1.652, P = 0.438).

