
Table S3.
Raw Fos counts after drug microinjections: Averages and SEs of total Fos in distant Fos sites after insula hotspot drug microinjections
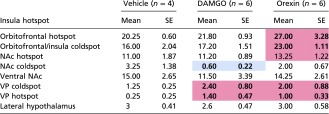 |
Red cells indicate >110% increase in Fos compared with vehicle levels. Blue cells indicate <75% Fos compared with vehicle levels. Bolded values indicate a Cohen’s d value greater than ±0.7.