Fig. 1.
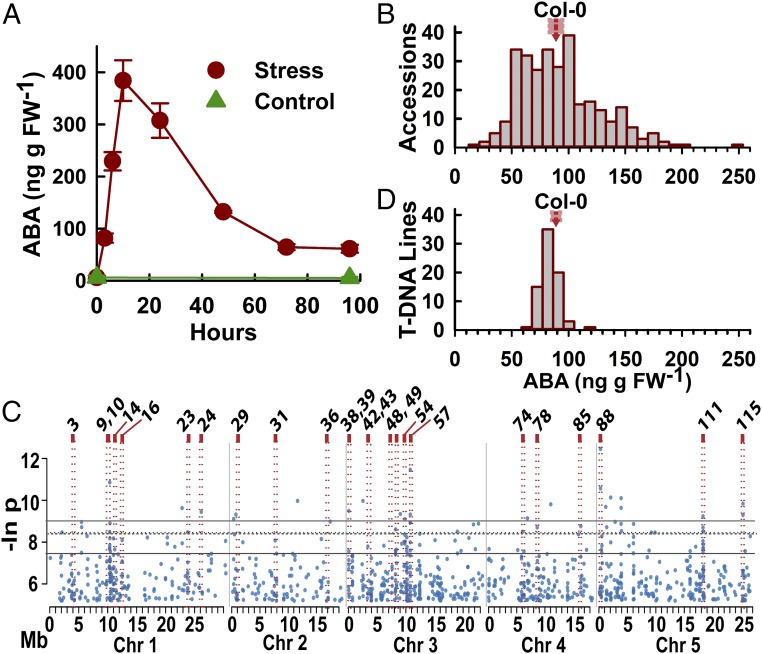
Natural variation and GWAS analysis of low-ψw–induced ABA accumulation. (A) Time course of ABA accumulation after transfer of 7-d-old Col-0 seedlings to control (−0.25 MPa) or low-ψw stress (−1.2 MPa). Data are means ± SE (n = 6) combined from two independent experiments. (B) Distribution of ABA contents at 96 h after transfer to −1.2 MPa for 298 A. thaliana accessions. The mean and SE of the Col-0 reference accession is indicated by the red arrow and red box, respectively. ABA data for each accession are given in Dataset S1. (C) Manhattan plot of SNP P values (expressed as the natural log, base e) versus genomic position for the top 1,000 (T1000) SNPs from GWAS analysis using the ABA data shown in B. Gray lines indicate the cutoffs for the top 100, and top 20 low P value SNPs. For reference, the dashed line indicates an FDR of 0.75. Red boxes indicate the positions of regions of interest for which we analyzed ABA accumulation for T-DNA mutants of one or more candidate genes. A total of 116 regions of interest were identified based on the GWAS analysis, and these were numbered consecutively through the genome from chromosomes 1–5 (SI Appendix, Fig. S2 and Dataset S3). (D) Distribution of ABA contents after low-ψw treatment for 75 T-DNA mutants. ABA data for all T-DNA mutants are given in Dataset S5. The mean and SE of Col-0 wild type are indicated.

