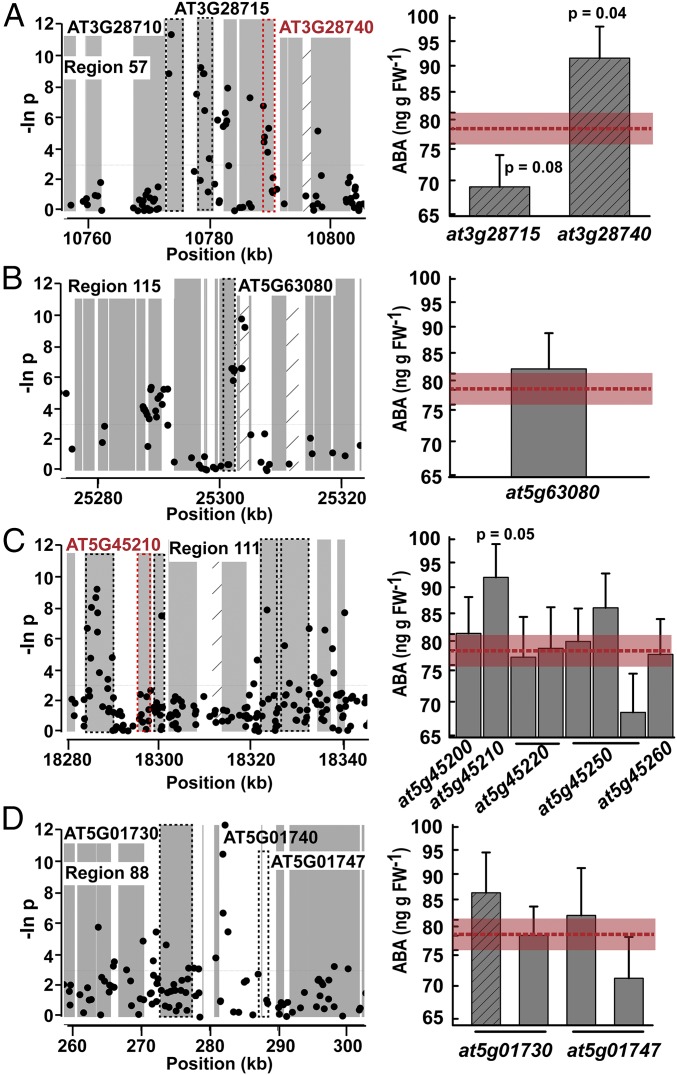
Fig. 3.
Analysis of top-scoring regions identified by ABA GWAS. Data are shown for four regions of interest (A–D) that had the highest scores in our heuristic ranking system (Dataset S4). The format of data presentation is the same as that described for Fig. 2 except that data of all T-DNA lines analyzed for a given region are shown (SNP P values are shown as natural log).

