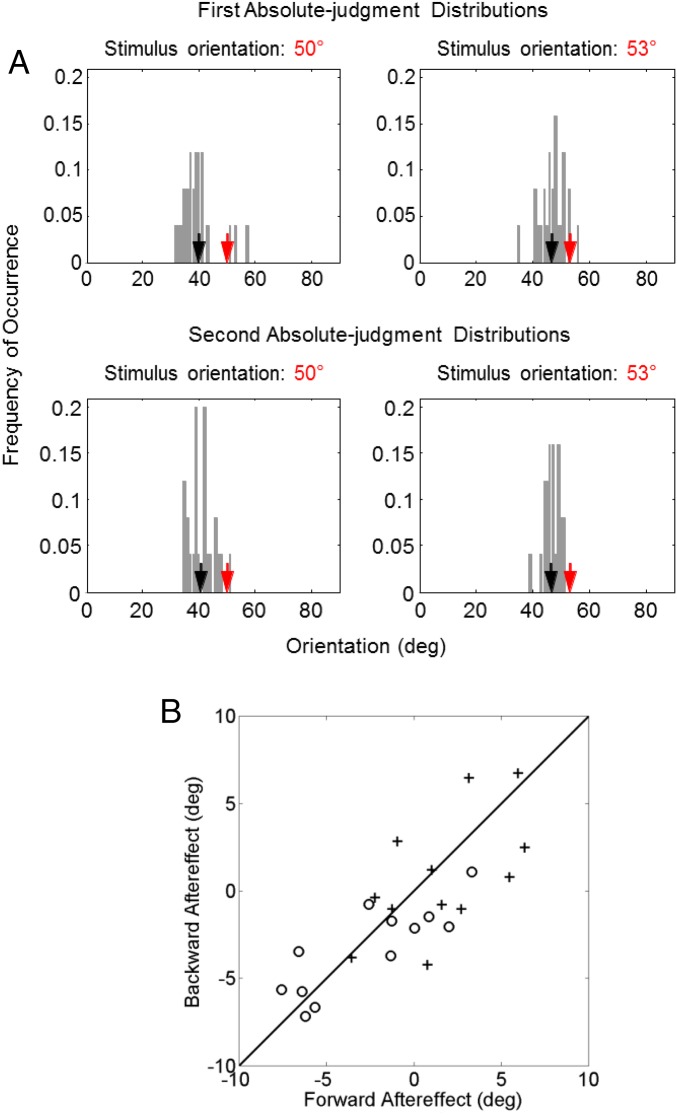
Fig. 5.
Forward/backward aftereffects between two lines in a trial. (A) The same naive subject’s first and second absolute-judgment distributions from the 2-line test condition. (They are obtained by splitting each of the distributions in the Bottom of Fig. 2; see Perceptual Decoding Cannot Be Explained by a Sequential Mechanism or by Conventional Adaptation.) The top and bottom rows represent the first and second absolute-judgment distributions, respectively; the left and right columns are for the 50° and 53° stimulus orientations, respectively. In each panel, the red and black arrows indicate the stimulus orientation and the mean of the distribution (i.e., the mean of the subject’s reported orientations), respectively. (B) The backward aftereffect plotted against the forward aftereffect for each of the 12 subjects. The open dots and crosses are results for the 50° and 53° stimulus orientations, respectively. Open dots in the third quadrant and crosses in the first quadrant indicate repulsive aftereffects. The figure show that large aftereffects were repulsive, but small ones were a mixture of repulsion and attraction. deg, degrees.

