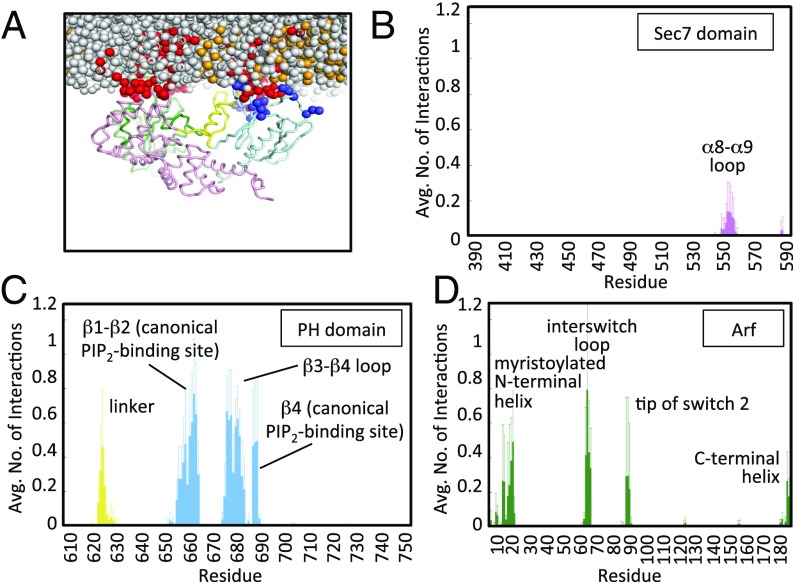
Fig. 3.
Coarse-grained MD simulations of myrArf/Brag2 on a membrane showing multiple PIP2 lipid-binding sites. (A) Close-up of myrArf/Brag2 at the end of the simulation run, for one run. Both myrArf and Brag2 bind primarily to PIP2 molecules in the membrane at multiple binding sites. (B) Time-averaged number of interactions between Sec7 domain residues and PIP2 lipids. (C) Time-averaged number of interactions between the linker and PH domain residues of Brag2 and PIP2 lipids. (D) Time-averaged number of interactions between Arf residues and PIP2 lipids. Color-coding for Brag2 and lipids is as in Figs. 1 and 2. Arf is in green.

