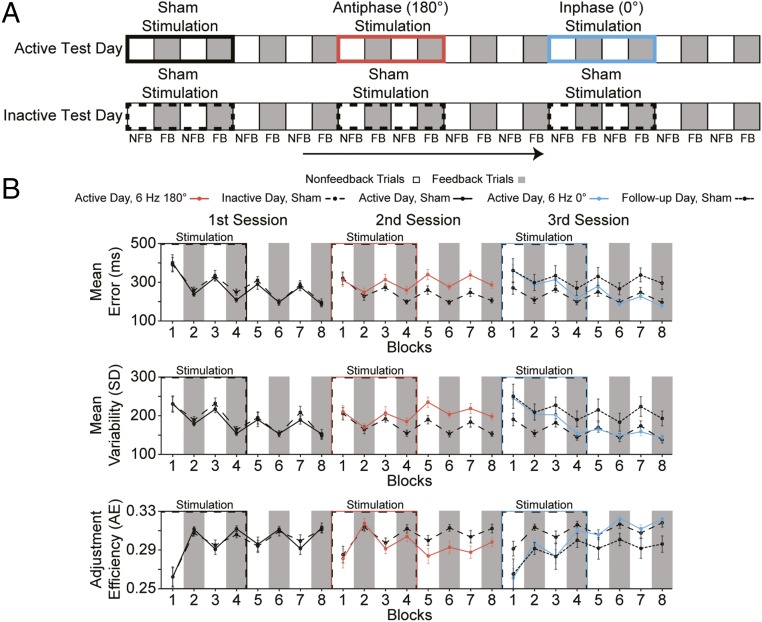
Fig. 3.
Experiment 3 design and results. (A) Schematic illustration of the experimental design. Each participant underwent an active test day consisting of three consecutive stimulation sessions (i.e., sham, antiphase, inphase) and an inactive test day consisting of three consecutive sham stimulation sessions. On each day, behavior was recorded for ∼120 min while subjects performed the time-estimation task in which blocks of feedback (FB, gray) and nonfeedback (NFB, white) trials were interleaved. (B) Performance measures of absolute error magnitude (Top), response variability (Middle), and adjustment efficiency (Bottom) across blocks of feedback (gray) and nonfeedback (white) trials are shown during and after the sham (solid black), antiphase (6 Hz 180°, red), and inphase (6 Hz 0°, blue) stimulation sessions on the active test day, and the three sham (dashed black) stimulation sessions on the inactive test day within the same subjects. The dotted black lines in the third session show data from the final sham session of the follow-up test in which a subset of subjects from Experiment 3 received the sequence of sham, antiphase, and sham stimulation to determine whether the deleterious effects of antiphase stimulation would continue over a more protracted time course or naturally improve and return to baseline levels without the assistance of inphase stimulation. Error bars show ±1 SEM.

