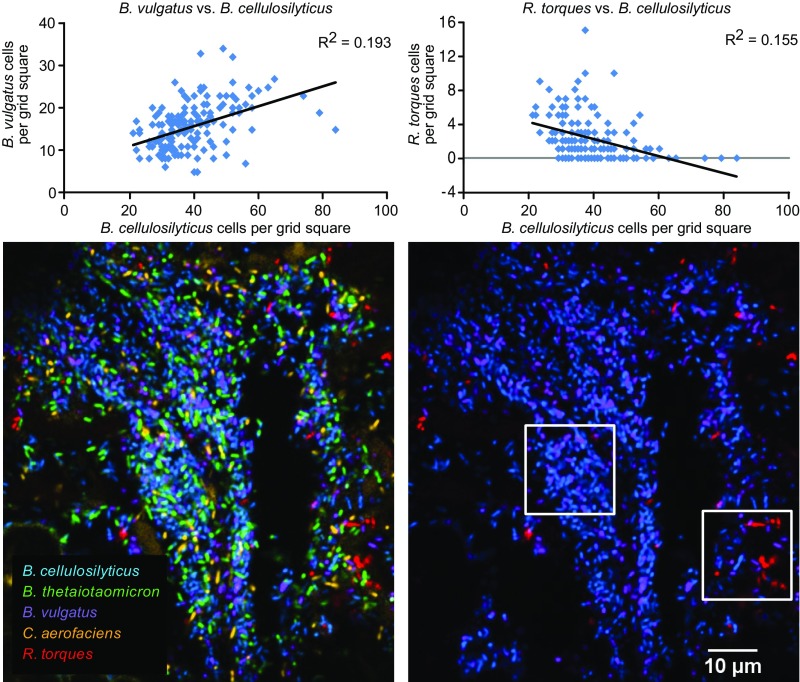
Fig. 6.
Distinctive organization of microbes relative to one another. Abundance of each taxon was tabulated within 1,572 grid squares measuring 19 × 19 μm (cf. individual squares in the heat map in Fig. 2) from a section hybridized with the species-specific probe set 1. Scatter plots of individual taxa show that the abundance of B. cellulosilyticus and B. vulgatus are positively correlated (Upper Left) while the abundance of B. cellulosilyticus and R. torques are negatively correlated (Upper Right). Scatter plots include only those grid squares that contain a high density of bacterial cells (at least 50% of the maximum density). An image of such a densely populated region (Lower) shows that B. cellulosilyticus and B. vulgatus are abundant in the same region of the image, while the abundance of R. torques is highest where abundance of the Bacteroides is low. These spatial relationships are consistent across mice, as demonstrated by analysis of both mice with the comprehensive probe set 3 (Fig. S4).

