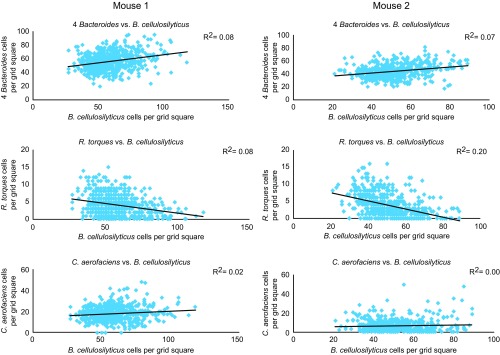
Fig. S4.
Distinctive organization of microbes relative to one another is consistent across mice and probe sets. The abundance of each taxon was tabulated within 19 × 19 μm grid squares from three sections from mouse 1 and two sections from mouse 2, all hybridized with probe set 3. The abundance of the most abundant taxon, B. cellulosilyticus, was plotted against the abundance of the set of B. thetaiotaomicron, B. ovatus, B. vulgatus, and B. uniformis all hybridized with the same fluorophore (“four Bacteroides”) and against R. torques and C. aerofaciens. Scatter plots include only grid squares that contained a high density of bacterial cells (at least 50% of the maximum density). Relative abundance relationships are modest but consistent across mice and consistent with those found using probe set 1 (Fig. 6).

