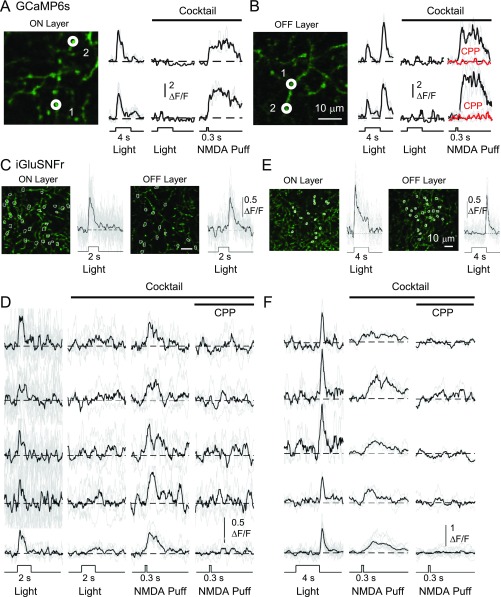
Fig. S3.
Glutamate imaging from iGluSnFR-expressing GAC dendrites. (A and B) Two-photon imaging of Ca2+ signals from ON (A) and OFF (B) varicosities of a GCaMP6s-expressing GAC, showing Ca2+ responses to NMDA puffs (2 mM, 300 ms, through a 2–5 MΩ pipette at 15 psi) in the presence of an antagonist mixture, containing 20 µM L-AP4, 10 µM ACET, 50 µM CNQX, 17 µM SR, 1 µM strychnine, and 25 µM 18-βGA. The NMDA-evoked responses had similar amplitudes as those responses to a light spot (100 µm diameter) recorded in the control solution. CPP (20 µM) completely blocked the NMDA-evoked responses (B). Note that the GAC response to the NMDA puff is presumably due to direct activation of NMDA receptors on the GAC, because the mixture was present to block indirect effects of NMDA on the GAC, and because bipolar cells do not express NMDA receptor. (C) Two-photon imaging of glutamate signals at dendritic varicosities of a GAC infected with iGluSnFR in a vGluT3-cre mouse, showing ON-only (Left) and OFF-only (Right) glutamate responses to light stimulation (100 µm diameter center spot) in the ON (Left) and OFF (Right) sublayers, respectively. (D) NMDA puff in the presence of the mixture evoked CPP-sensitive glutamate release from four representative varicosities in C (Left), which showed an ON, but no detectable OFF, glutamate response to light stimulation in the control solution. (E and F) Similar iGluSnFr imaging results as in C and D, except from four representative varicosities in the OFF layer of a different GAC (F). These OFF varicosities exhibited an OFF, but no detectable ON, glutamate response to light stimulation, even though they could be evoked to release glutamate by the NMDA puff. In D and F, the top four rows of traces are individual responses from the representative varicosities, and the bottom row shows averaged responses from the four varicosities. Note that only a fraction (∼25%) of the varicosities in the ON and OFF layers showed clearly detectable glutamate releases in response to NMDA puffs. In A, B, D, and F, black represents averaged responses from three to four trials, and gray represents individual trials. In C and E, black represents averaged responses from selected varicosities, and gray represents responses from individual varicosities.

