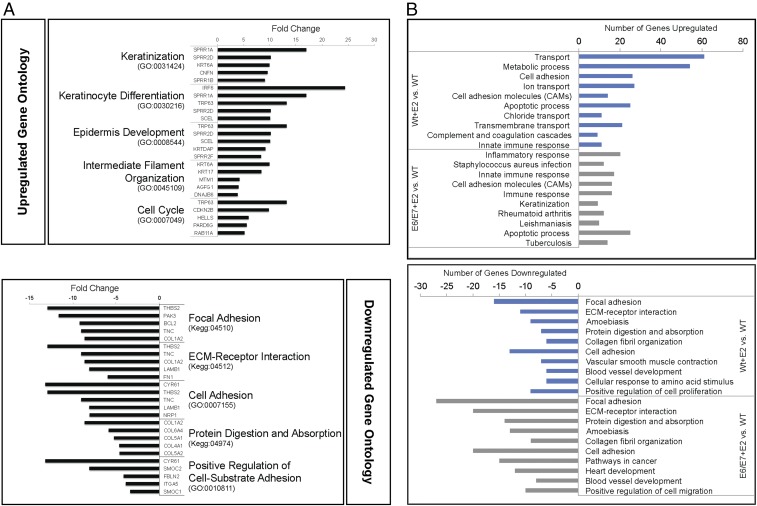
Fig. 2.
GO analysis of differentially expressed genes. (A) GO of up-regulated (Upper) and down-regulated (Lower) genes differentially expressed in K14E6/E7 versus nontransgenic stroma. The top five most significant GO groups are shown (for P values, see Table S2) along with GO identifiers in parentheses. The five genes classified in each GO group with the highest fold-change values measured between E6/E7 and WT groups are shown in the bar graphs. (B) GO comparisons of genes differentially expressed in WT+E2 versus WT stroma (blue bars) and E6/E7+E2 versus WT stroma (gray bars). The top 10 most significant GO groups are shown (for more details, see Tables S3 and S4) for the up-regulated genes (Upper) and down-regulated genes (Lower). The number of genes in each GO group that are differentially expressed in each comparison is indicated in the bar graphs.

