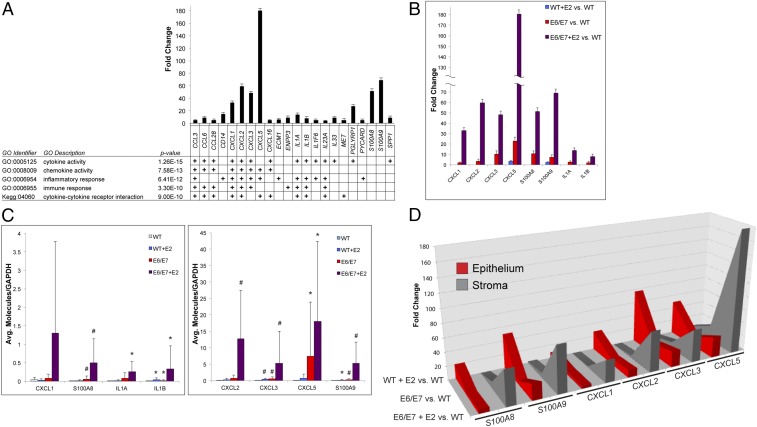
Fig. 4.
Inflammation-associated gene expression is increased by epithelial E6/E7 expression and is exacerbated by chronic estrogen treatment. (A) GO was performed on the 87 extracellular genes up-regulated in the E6/E7+E2 stroma identified in Fig. 3A. The most significant GO groups associated with these genes are shown. Individual genes driving the significant GO associations are shown; a plus sign denotes that the gene is classified in the corresponding GO group. The fold change of each gene in the E6/E7+E2 stroma compared with WT stroma is shown in the bar graph. Error bars indicate SD. (B) Fold-change values are shown for a representative group of core genes (x axis) in the inflammatory signature identified in A. The fold change of each gene in the stroma of WT+E2 (blue bars), E6/E7 (red bars), and E6/E7+E2 (purple bars) compared with WT stroma is shown. Error bars indicate SD. (C) RT-PCR validation of selected inflammation-associated genes. RNA from laser-captured stroma was used to measure transcript levels of the indicated genes using RT-PCR. Statistical analysis was performed using a Wilcoxon rank-sum test. #P ≤ 0.01, *P ≤ 0.05 compared with WT. Error bars indicate SD. (D) Comparison of fold-change values for selected inflammation-associated genes in the epithelium (red) and stroma (gray) in WT+E2 (rearmost values), E6/E7 (middle values), and E6/E7+E2 (foremost values) compared with WT stroma.

