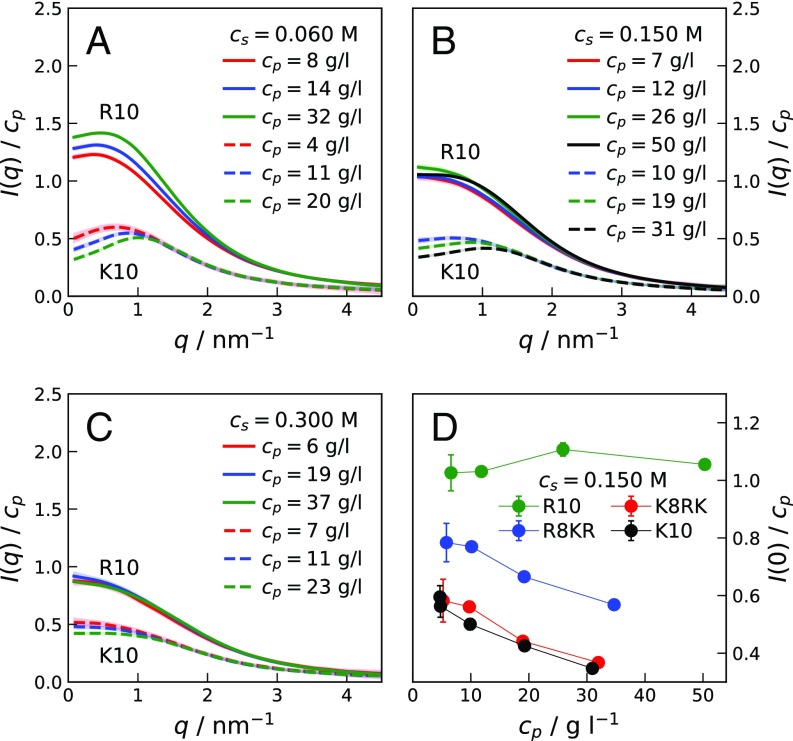
Fig. 1.
(A–C) Concentration-normalized scattering intensities for R10 (solid lines) and K10 (dashed lines) at various peptide concentrations, , in 0.020 M Tris buffer solutions of 0.060 M (A), 0.150 M (B), and 0.300 M (C) ionic strength, . (D) Extrapolated values for samples of R10, K10, R8KR, and K8RK of increasing at M. Lines connecting points in D are guides to the eye.

