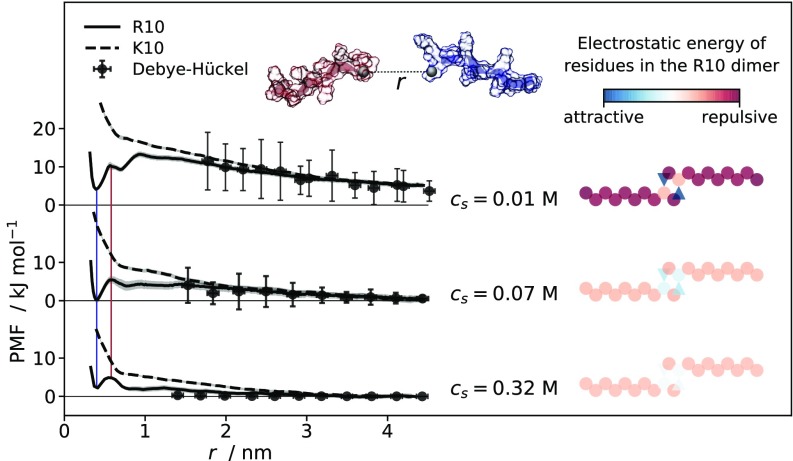
Fig. 2.
(Left) PMFs calculated from umbrella-sampling MD simulations for pairs of R10 (solid line) and K10 (dashed line) molecules at M, M, and M as a function of the separation between the guanidino-C and the -C atoms of the ninth residues. Shaded areas along the PMFs represent standard deviations (SD) of bootstrapped free energy profiles. Colored vertical lines connect maxima and minima that are common to all PMFs. Points represent free energy values calculated using the Debye–Hückel approximation, while error bars reflect SD of mass–center separations between peptides in the umbrella-sampling simulation windows. (Top Center) Generic representation of the deca-peptides where the ninth residues’ guanidino-C/-C atoms are the black spheres and the dashed line between them represents the reaction coordinate, . (Right) Schematic illustration of R10 dimeric structures. The circles and triangles represent positively charged arginine residues and negatively charged C-terminal carboxyl groups, respectively; while the coloring is based on the Debye–Hückel free energy calculated for each charge site interacting with all of the others, in the geometry adopted for the illustration.

