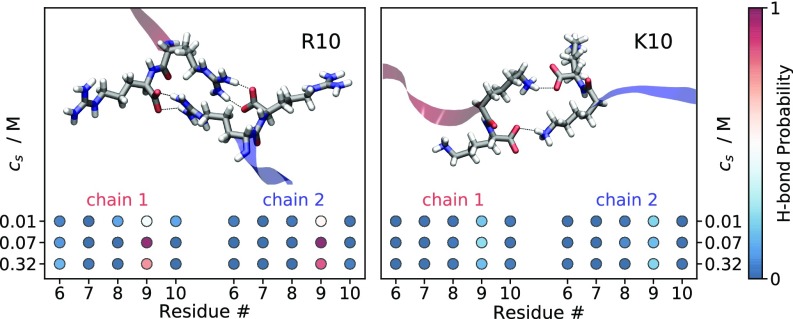
Fig. 3.
Snapshots from MD simulations illustrating the interaction between C-terminal residues of two R10 and two K10 molecules at close separation. Dashed lines represent the hydrogen bonds between the negatively charged carboxyl groups and the positively charged guanidinium and ammonium moieties of the ninth residues. Colored circles represent the probability of H bonds between the carboxyl groups of one peptide and the last five residues of the other peptide. Snapshots and probabilities are obtained from MD simulations with separations of 0.43 0.04 nm and 0.74 0.06 nm between the ninth residues’ guanidino-C and -C atoms, respectively.

