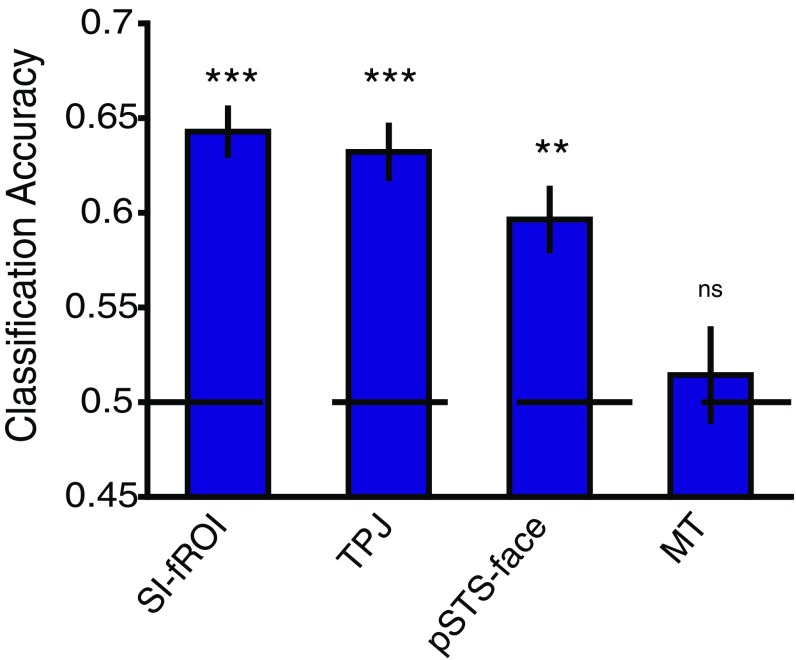
Fig. 5.
fROI responses to experiment 1 stimuli. Shown are the average beta values (mean ± SEM) across subjects in each individually defined fROI (A, SI-fROI; B, TPJ; C, pSTS face; D, MT) for each condition from the three fROI-defining contrasts: point light walkers interacting vs. independent (experiment 1), false belief vs. false photo stories (standard theory of mind localizer), and faces vs. objects. All beta values are calculated from a held-out localizer run that was not used to the define the fROI. **P ≤ 0.01; ***P ≤ 0.001; ns, not significant, P > 0.05.

