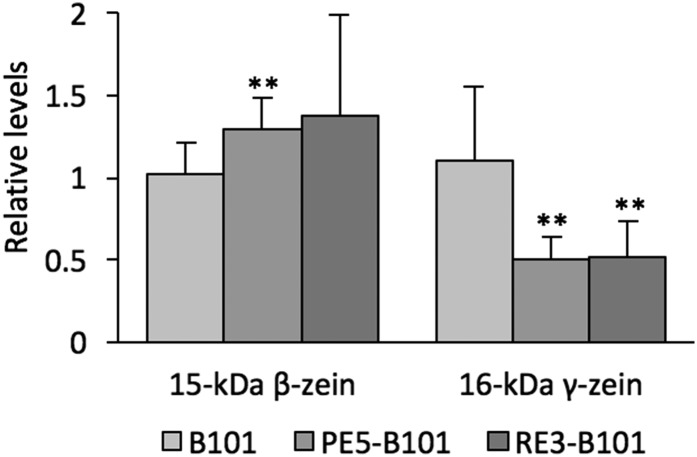
Fig. S3.
Relative expression levels of the 15-kDa β- and 16-kDa γ-zein transcripts in the endosperm of 16-d postpollination PE5-B101 and RE3-B101 kernels. Statistical analysis was performed with the Student’s t test: significantly different from the B101 control at **P < 0.01. Data shown are means ± SD of three determinations each from two biological replicates.

