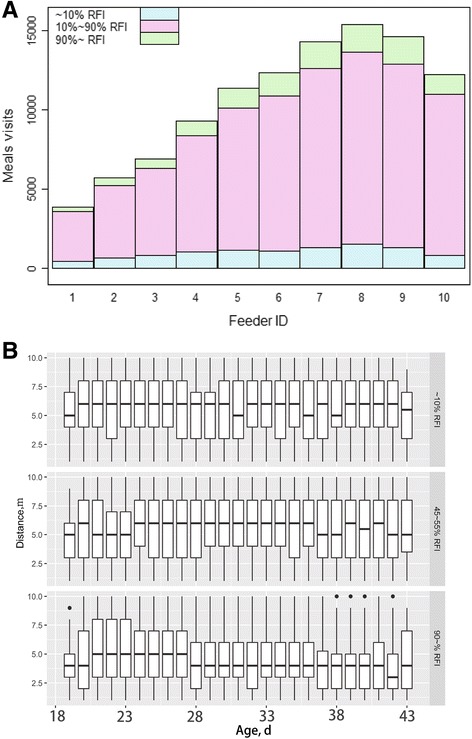
Fig. 2.

a The distribution of visits recorded by feeders. X axis denotes the feeder ID, and Y axis denotes the number of visits. Different colors represent three RFI levels of the ducks, respectively. Feeding machine is linearly layout from number one to ten. The first machine was closest to the gate, and the last one was far away from gate. All of invalid visits were removed. b Comparison of duck feeding tendencies in different RFI level groups. X axis represents the age of birds, and Y axis represents the distance between feeder and door. The box plot represents the range of feeding activities at different RFI levels. The data of the last day was removed, because at this fasting time the ducks were considered to be under stress. Variance analysis showed that the machine position that high RFI ducks tended to eat in was significantly lower (i.e. closer to the gate) than other ducks, over the entire time period (P < 0.01). The initial bird age was 19 d
