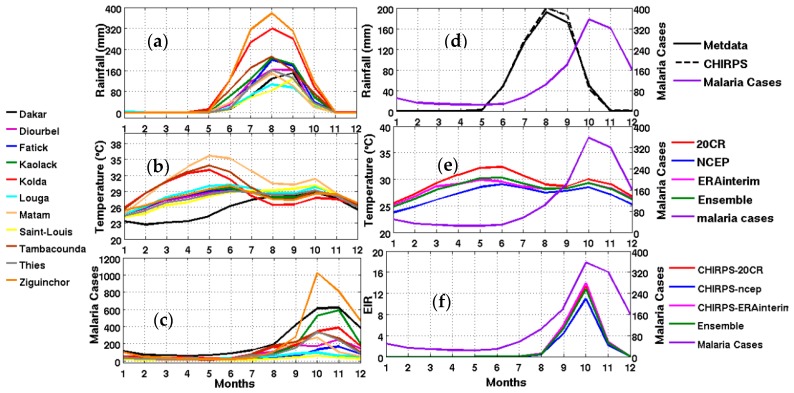
Figure 2.
Left panel: (a) observed rainfall in mm; (b) averaged reanalysis temperature in °C (20th century reanalysis (20CR), NCEP, and ERA Interim); (c) mean annual cycle of observed malaria cases for different Senegalese stations from 2001 to 2010 corresponding to the common available period of observed rainfall and reanalyses data (20CR, NCEP, and ERA Interim and the ensemble mean of reanalyses); Right panel: Mean annual cycle of climate parameters, the simulated malaria parameter, and observed malaria cases: (d) rainfall; (e) temperature; (f) Entomological Inoculation Rate (EIR) (common period 2001–2010) and observed malaria cases in averaged Senegal stations (right y-axis for each figure).

