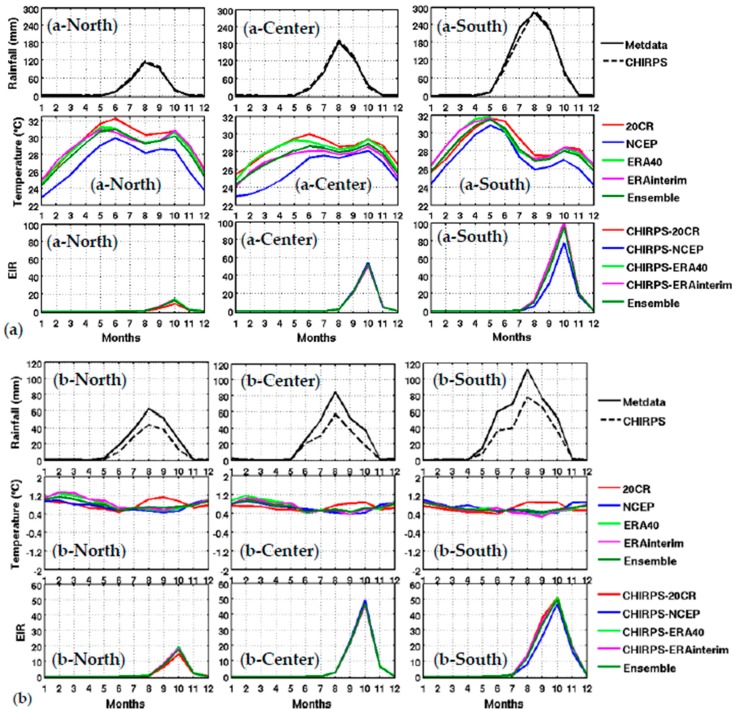
Figure 3.
Upper panel: Mean annual cycle of climate parameters and the simulated malaria parameter: (a) Meteorological rainfall data based on weather stations (Metdata) and CHIRPS satellite rainfall (CHIRPS), reanalysis temperature (20CR, NCEP, ERA40, and ERA Interim) and simulated EIR based on CHIRPS rainfall and reanalysis temperature (CHIRPS-20CR, CHIRPS-NCEP, CHIPRS-ERA40, CHIRPS-ERA Interim, and the ensemble mean of all reanalyses), for different Senegal zones (northern in column 1: spatial average for Saint-Louis, Louga, and Matam), central in column 2 (spatial average for Dakar, Thies, Kaolack, Fatick, and Diourbel) and southern in column 3 (spatial average for Ziguinchor, Kolda, and Tambacounda) for the period 1981–2001. Lower panel: (b) idem as the upper panel, but for the standard deviations (SD).

