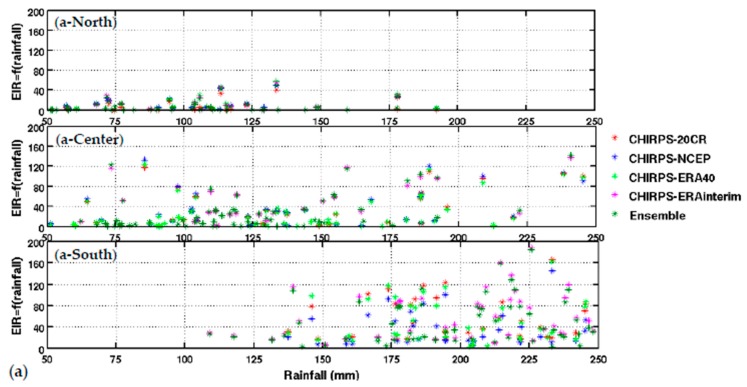
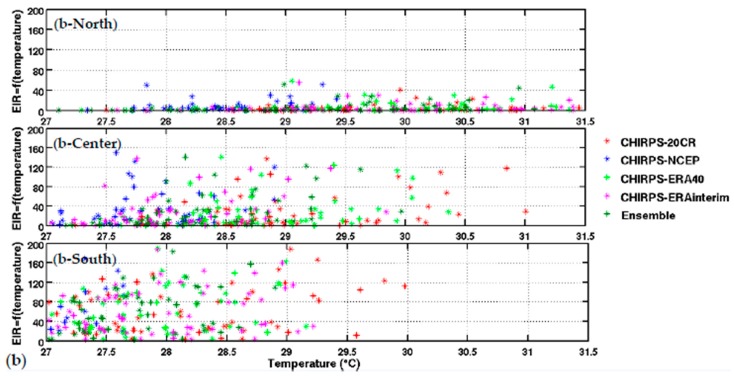
Figure 4.
Upper panel: (a) variation of EIR as a function of rainfall by averaged Senegal zones (North, central, and South. Lower panel: (b) variation of EIR as a function of temperature by averaged Senegal zones (North, central, and South). The rainfall is from CHIRPS, and the temperature is derived from different reanalysis data. Simulated EIR are shown for the common period 1981–2001.


