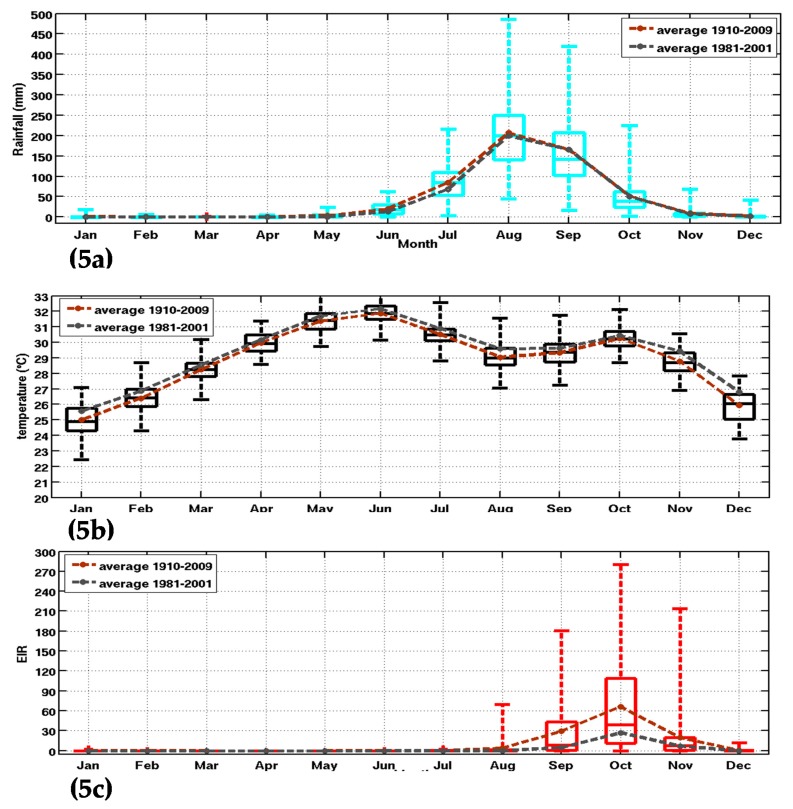
Figure 5.
Box-and-whisker plot of climate parameters and the simulated malaria parameter: (a) rainfall (mm); (b) temperature (°C); and (c) simulated EIR (infectious bites per person per month) in Senegal. The whiskers and max/min outliers are shown for inputs and outputs of the Liverpool Malaria Model (LMM) for the 20th CR dataset (1910–2010). The boxes mark the median, the 25th, and the 75th percentile, while the whiskers give the minimum and maximum values. The brown and grey curves represent, respectively, the superimposed mean annual cycles on the Box-and-whisker for 1910–2009 and the common climatological period to the other reanalysis dataset (1981–2001).

