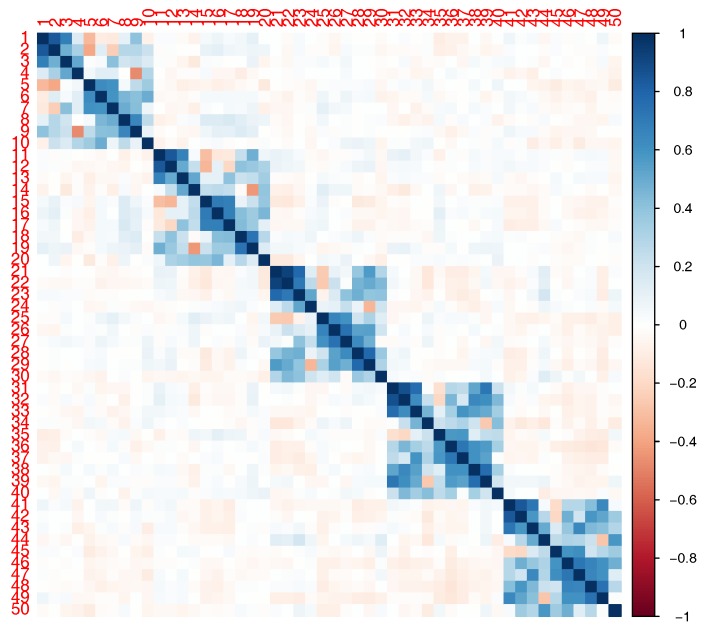
Figure 2.
Correlation of the 50 simulated single nucleotide pollymorphisms (SNPs) in linkage disequilibrium (LD). The vertical color line to the right indicates the level of correlation between the SNPs. The dark blue (red) means high positive (high negative) correlation and the light blue (red) means low positive (low negative) correlation.

