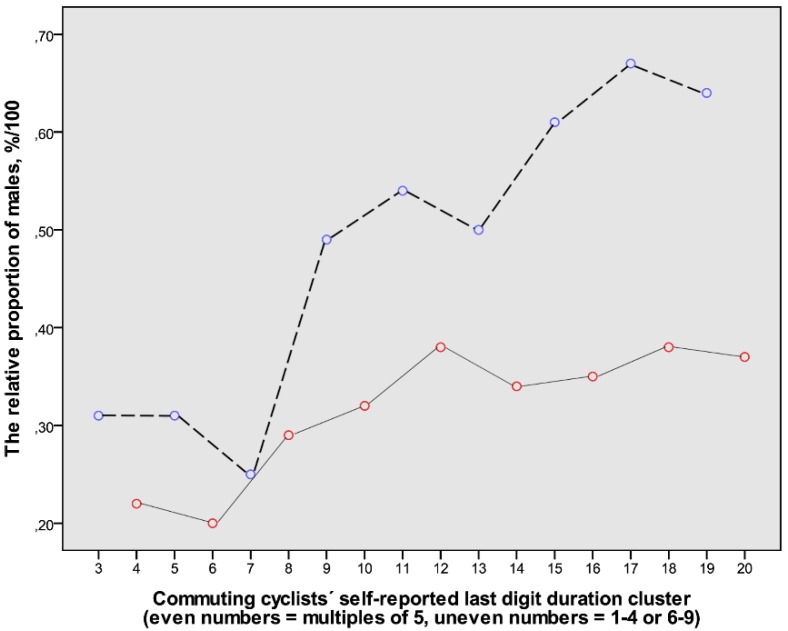
Figure 4.
The relative proportions of data from male participants in clusters of self-reported cycling durations (n = 1516). The range of clusters (3–20) represents durations from 6–9 min to 50 min. The even-numbered clusters represent durations with the last digits being 0 or 5 (red symbols connected with continuous lines). The uneven-numbered clusters represent durations with the last digits being 1–4 or 6–9 (blue symbols connected with dashed lines). Cluster 4 = 10 min; 8 = 20 min; 12 = 30 min; 16 = 40 min; and 20 = 50 min. For further explanations, see Methods.

