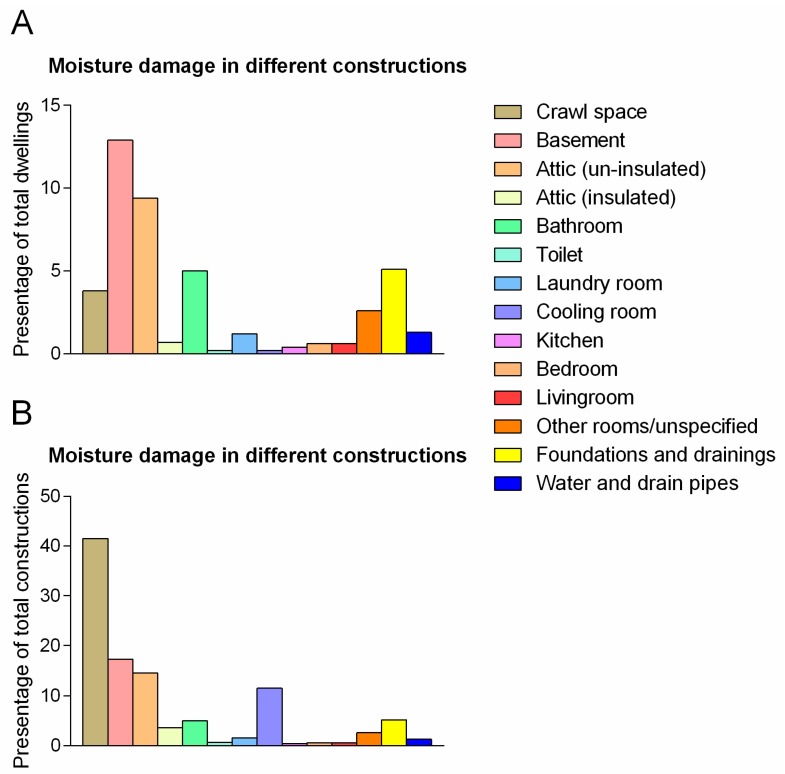
Figure 4.
Moisture damage distributed by construction/room type. The figure display percentage of Norwegian dwellings with moisture damage in the different rooms (A) and the percent of the respective rooms with moisture damage (B). For instance, only a few inspected dwellings had crawl spaces or cooling rooms. Thus, while moisture damaged crawl spaces and cooling rooms were reported in less than 5% and 1% of all dwellings respectively, more than 40% of all crawl spaces and more than 10% of all cooling rooms were moisture damaged.

