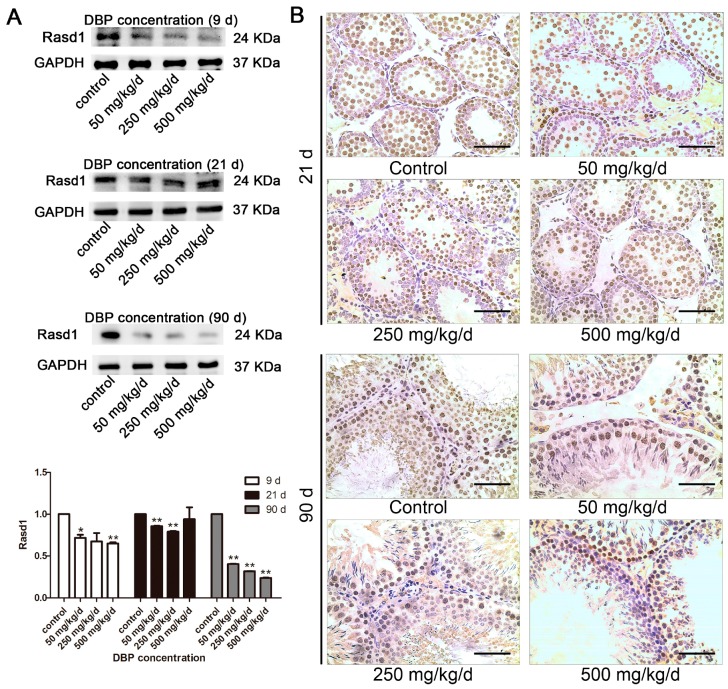
Figure 5.
The effects of DBP on Rasd1 analysis: (A) The protein level of Rasd1 in testicular tissue treated with various concentrations of DBP were measured by Western blot. The expression of Rasd1 was quantified with ImageJ (lower panel; n = 3). GAPDH was used as a loading control; (B) Rasd1 in rat testicular tissue was revealed by immunohistochemistry. Results are expressed as means ± S.D. ** p < 0.01; * p < 0.05. Scale bar = 100 μm.

