
Fig. 2.
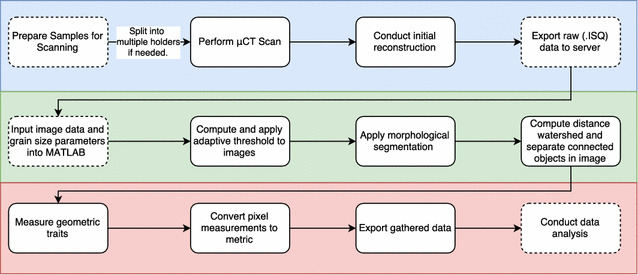
Schematic representation of the developed µCT imaging pipeline. Coloured areas represent the different stages of the method. µCT scanning and reconstruction (blue), segmentation and 3D processing (green) and feature extraction and analysis (red). Solid lines represent automated steps while dashed lines steps that require user input