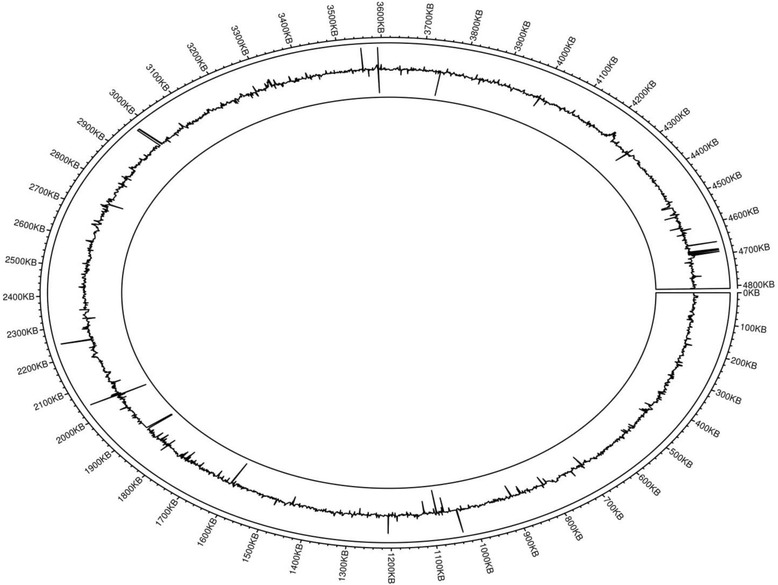
Fig. 3.

Circular plot of the reads mapping to the S. Typhi CT18 genome. The outer circle shows the genomic track, marked in 100 kb increments. The peaks in the track represent the log2-fold change of each gene, e.g. up-regulated genes STY1254 (1,207,090...1207347), and yheA (4,231,386...4231580), and down-regulated genes rmf (1,066,679...1066846) and STY1156 (1,116,294...1116461)
