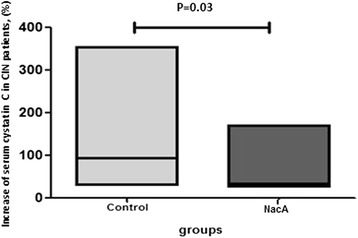
Fig. 2.

Serum cystatine C levels changes (%) between baseline and time of radio contrast induced nephropathy (CIN) diagnosis in controls and in patients who received antioxidants (NacA group). The horizontal lines in the low-high bar graphs represent median values. The statistical significance is indicated with the capped line
