
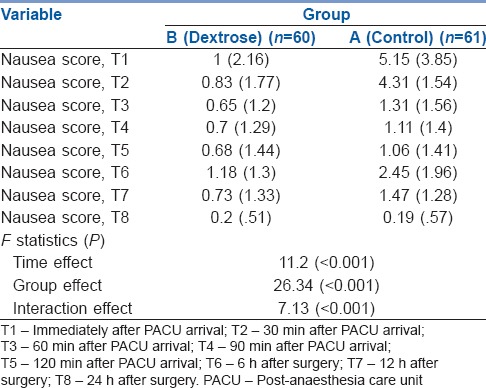
Table 2.
Mean (standard deviation) of nausea scores at T1–T8 follow-up times in both groups
Official websites use .gov
A
.gov website belongs to an official
government organization in the United States.
Secure .gov websites use HTTPS
A lock (
) or https:// means you've safely
connected to the .gov website. Share sensitive
information only on official, secure websites.
Mean (standard deviation) of nausea scores at T1–T8 follow-up times in both groups