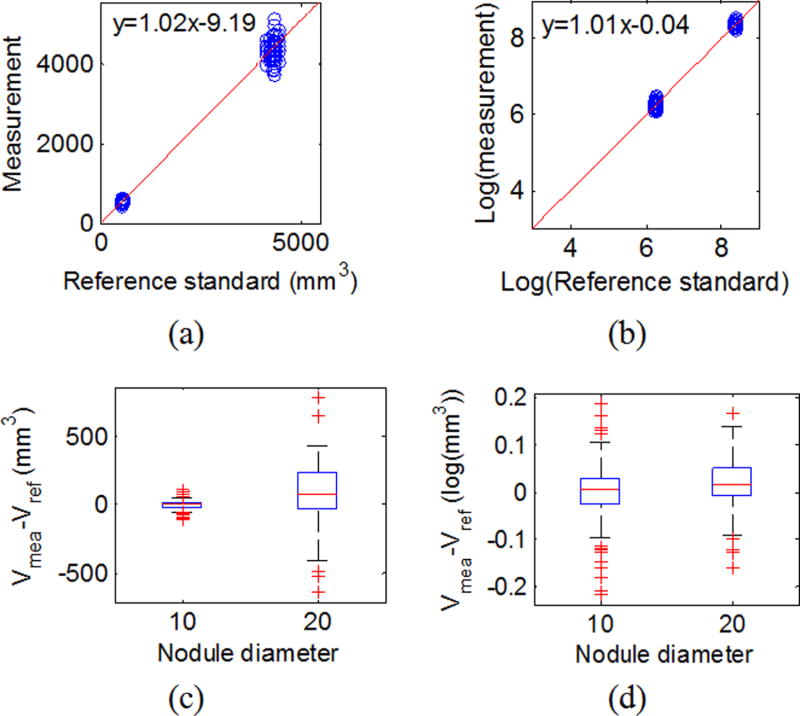
Fig. 4.
Linearity for QIBA Profile subset (subset-Q). (a) Scatter plot for reference standard and measurements with the red line being the linear regression line on the original scale. (c) Box-and-whisker plot of the difference between the measurement and the reference standard by size in the original scale. (b) and (d) are the same plots in the log-transformed domain.

