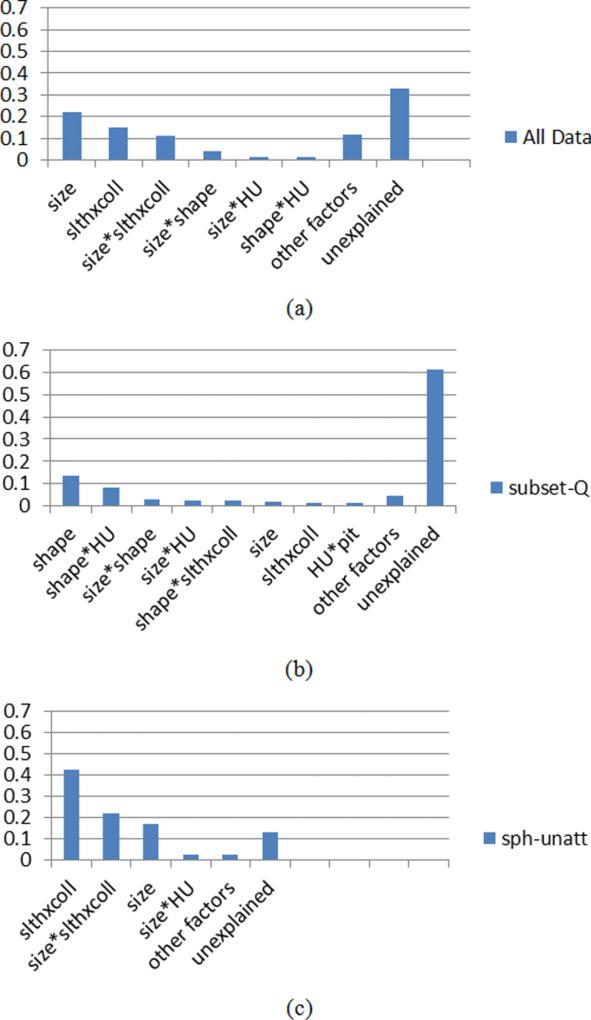
Fig. 5.
Factors ranked according to eta-squared (from ANOVA with two-factor interactions) for (a) all data; (b) QIBA Profile set; (c) spherical unattached data. The bar named other factors includes those with <0.01 eta-squared. Total sum of squares equals 1160.63 (d.f. = 39 716), 18.35 (d.f. = 9180), and 95.95 (d.f. = 6479) for (a)–(c), respectively. Note the magnitude of unexplained error exceeds the sum of the other values in only (b).

