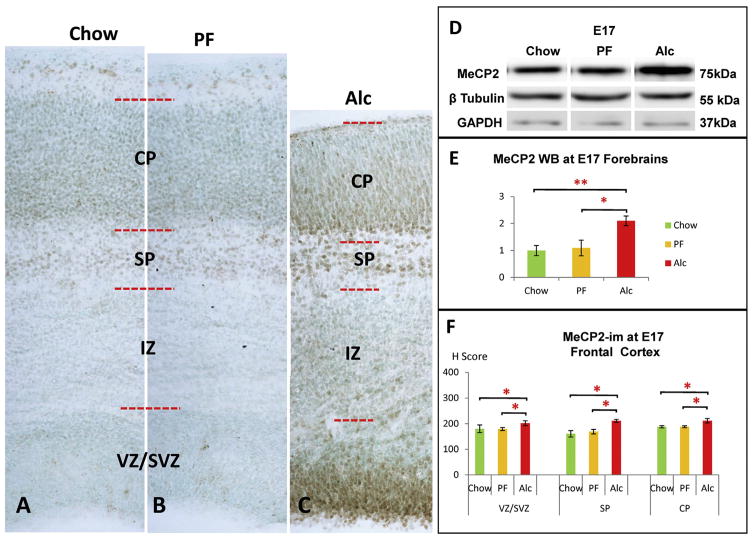
Fig. 8.
Alcohol-induced MeCP2 increase in the E17 cortex. (A–C) Representative columns from the E17 frontal cortex across the three groups. (C, F) Alcohol increased MeCP2-im throughout cortical SVZ/VZ, SP, and CP layers compared to controls. No significant change was observed between Chow and PF groups. *p < 0.05. N = Chow (5), PF (4), Alc (5). (D–E) Densitometry of MeCP2 whole-brain Western blot (WB) showed a significant increase of MeCP2 expression at E17 in the Alc group compared to its counterparts. (One-way ANOVA: F = 6.95, p < 0.05). Post hoc analysis showed no significant difference between PF and Chow groups. Western blot band intensity was normalized to GAPDH as an internal control. N = Chow (4), PF (3), Alc (4) mean ± SEM *p < 0.05 **p < 0.005. WB (Western blot).

