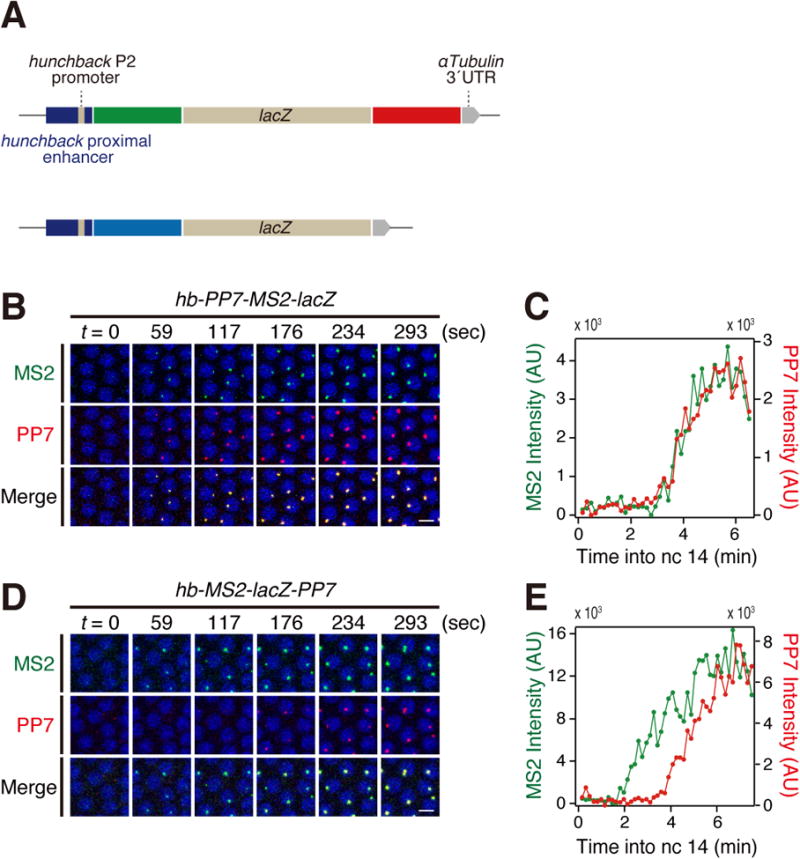
Figure 1. Visualization of Pol II elongation in living embryos.

(A) Schematic representation of MS2-lacZ-PP7 and PP7-MS2-lacZ reporter genes containing hb proximal enhancer and P2 promoter.
(B) Representative snapshots of embryo expressing hb-PP7-MS2-lacZ at the onset of nc 14. Nuclei were visualized with His2Av-eBFP2. Scale bar indicates 5 μm.
(C) Representative trajectory of MS2 and PP7 intensities in an individual nucleus expressing hb-PP7-MS2-lacZ. The time resolution is 9.77 sec (same in all subsequent figures).
(D) Representative snapshots of embryo expressing hb-MS2-lacZ-PP7 at the onset of nc 14. Nuclei were visualized with His2Av-eBFP2. Scale bar indicates 5 μm.
(E) Representative trajectory of MS2 and PP7 intensities in an individual nucleus expressing hb-MS2-lacZ-PP7.
See also Movie S1-3.
