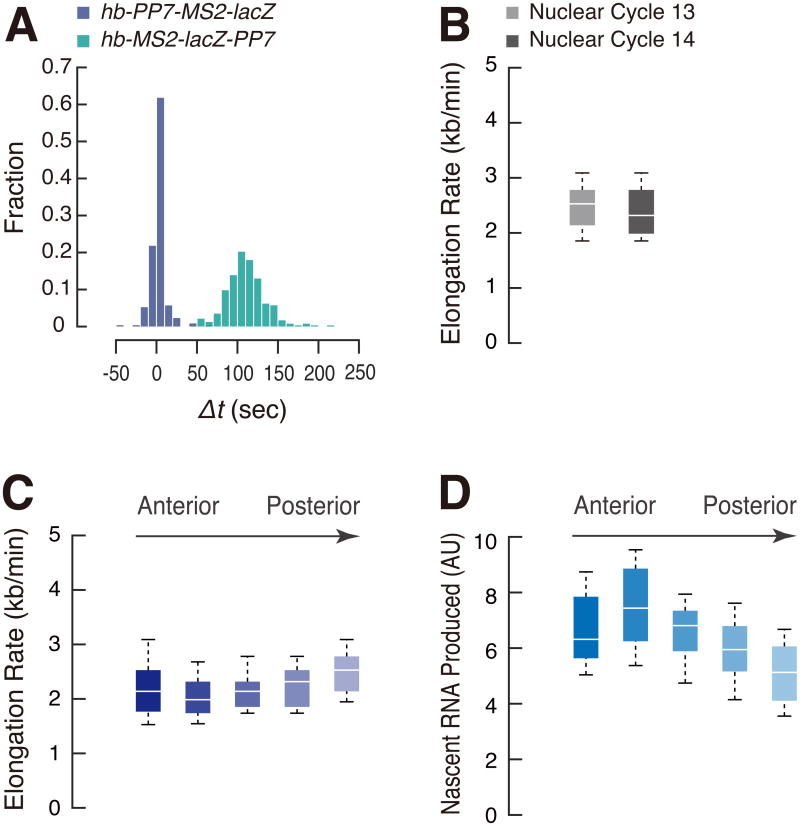
Figure 2. Rapid rates of Pol II elongation in early embryos.
(A) Differential activation kinetics of hb-PP7-MS2-lacZ and hb-MS2-lacZ-PP7 at the onset of nc 14. Δt values from a single embryo were plotted for each reporter.
(B) Boxplots showing the distribution of elongation rate per nucleus. 287 and 877 nuclei from two independent embryos (nc 13) and three independent embryos (nc 14) were analyzed. The box indicates the lower (25%) and upper (75%) quantile and the solid line indicates the median. Whiskers extend to 10 th and 90 th percentile of distribution (and in all subsequent figures). Elongation rate was calculated by dividing the length of the template DNA (lacZ plus 24× PP7; 4537 bp) by Δt.
(C, D) Boxplot showing the distribution of elongation rate (C) and output (D) in AP binned nuclei. 23, 49, 66, 80 and 72 nuclei from the same embryo at nc 14 were analyzed.
See also Figure S1 and S2.

