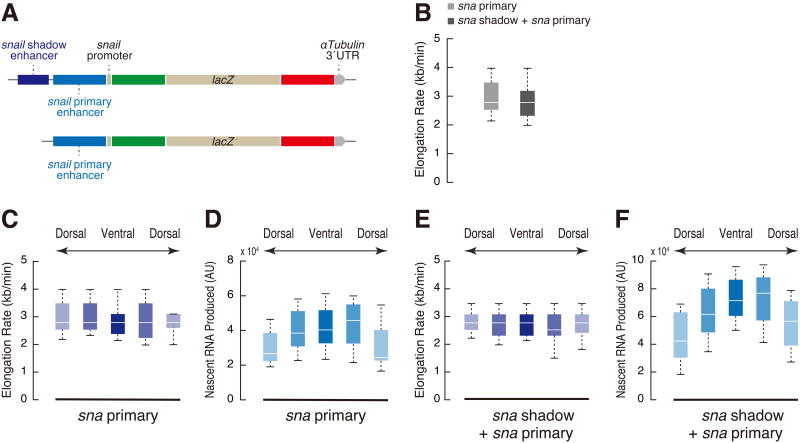
Figure 3. Elongation rate does not scale with the level of nascent RNA synthesis.
(A) Schematic representation of MS2-lacZ-PP7 reporter genes containing sna shadow enhancer, sna proximal enhancer and minimal 100 bp sna promoter.
(B) Boxplots showing the distribution of elongation rate per nucleus. 379 (sna primary) and 573 (sna primary + shadow) nuclei from two independent embryos at nc 14 were analyzed.
(C, D) Boxplot showing the distribution of elongation rate (C) and output (D) in dorsal-ventral binned nuclei in the transgenic embryo expressing sna primary-MS2-lacZ-PP7. 17, 55, 55, 44 and 15 nuclei from the same embryo were analyzed.
(E, F) Boxplot showing the distribution of elongation rate (E) and output (F) in dorsal-ventral binned nuclei in the transgenic embryo expressing sna shadow-sna primary-MS2-lacZ-PP7. 30, 67, 78, 70 and 52 nuclei from the same embryo were analyzed.
See also Figure S3.

