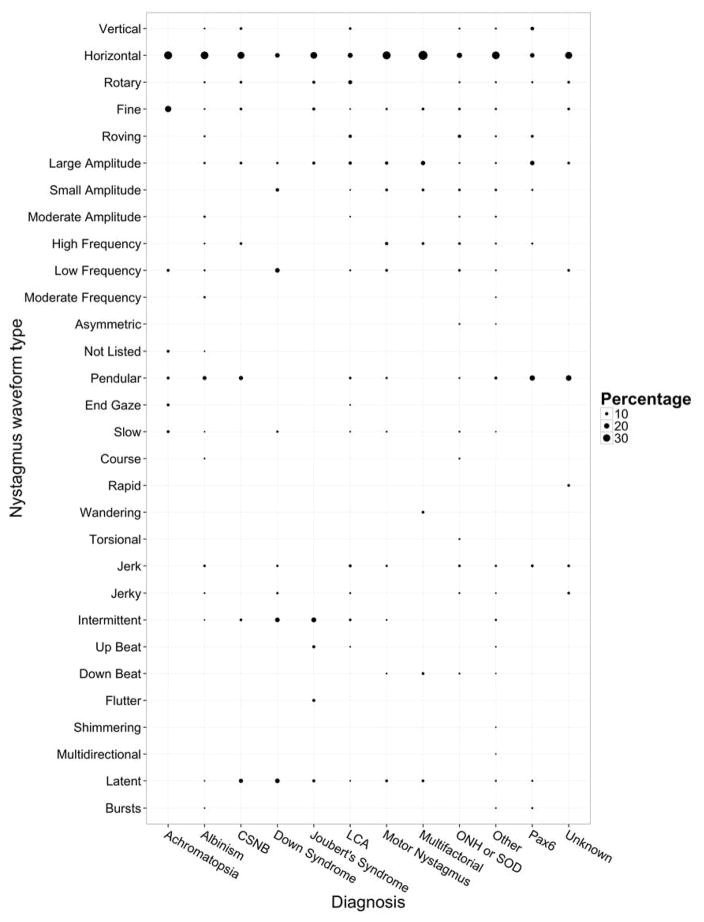
Figure 8.
Nystagmus waveform type versus diagnosis by percentage. The y-axis represents the nystagmus waveform types. The x-axis represents a selection of the most common diagnoses. The waveform types may add up to more than 100% per diagnosis due to some patients having more than one waveform type mentioned in the clinical description of their nystagmus in the chart.

