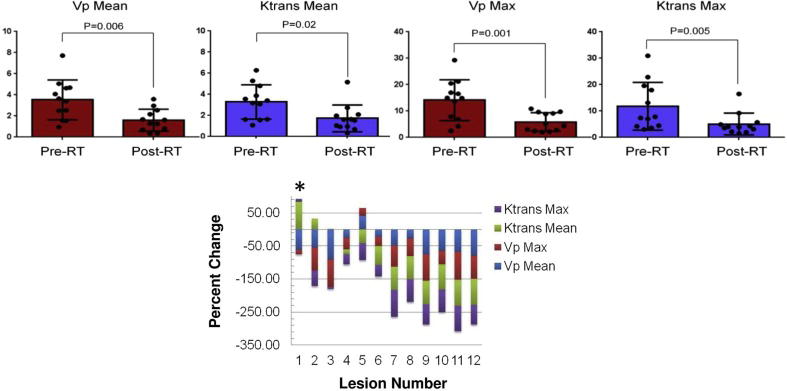
Figure 3.

Change in perfusion parameters Vp and Ktrans mean and max post-SBRT. A) As a cohort, all parameters demonstrate a significant decrease post-SBRT. B) Individual waterfall plot of all parameters and their relative percent change post-SBRT. Patient 1, who developed a local failure, demonstrated an increase in Ktrans mean and max and had small reductions in Vp max. *Indicates patient who experienced a local failure.
