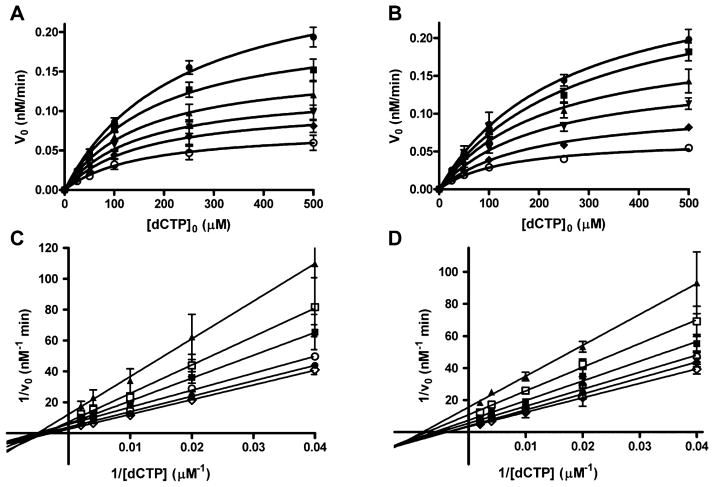
Figure 4.
Inhibition of the pol β and pol λ catalyzed incorporation of dCTP into DNA by honokiol. Initial rate versus dNTP plot for (A) pol β and (B) pol λ. The lines are the best fit to eq 2. Lineweaver–Burk plots for (C) pol β and (D) pol λ. The lines are the best fit to a linear equation. The HNL concentrations are 0 (open circle), 25 (diamond), 50 (down triangle), 100 (up triangle), 250 (square), and 500 (filled circle) μM. Each point represents the mean ± SEM of three experiments.

