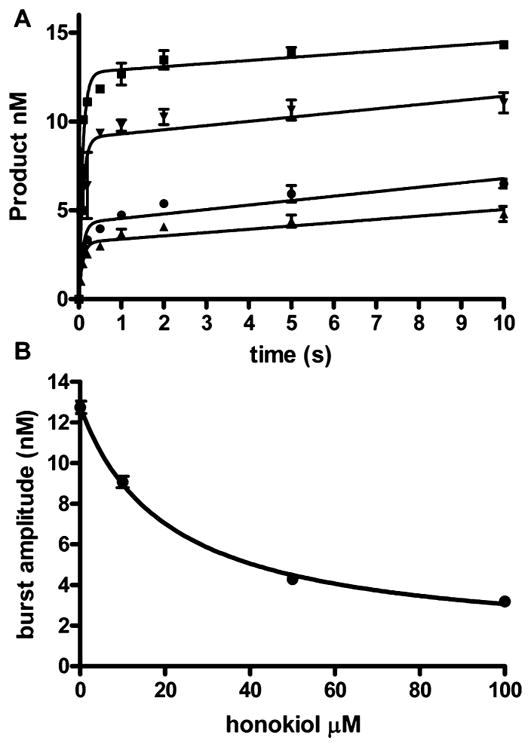
Figure 5.

Reduced pol β burst amplitudes in the presence of honokiol. (A) Time course for the insertion of 200 μM dCTP opposite dG in the presence of 0 (square), 10 (down triangle), 50 (circle), and 100 (up triangle) μM honokiol. The lines are the best fit to the burst equation. The kb and kss were unchanged with increasing honokiol concentrations at 11.7 ± 1.0 s−1 and 0.2 ± 0.6 nM−1 s−1, respectively. (B) Plot of burst amplitude versus honokiol concentration. The line is the best fit to the hyperbolic equation with Amax = 12.8 ± 0.3 nM, Amin = 1.0 ± 0.5, K = 21 ± 4 μM. The data points are the mean ± SEM of three experiments.
