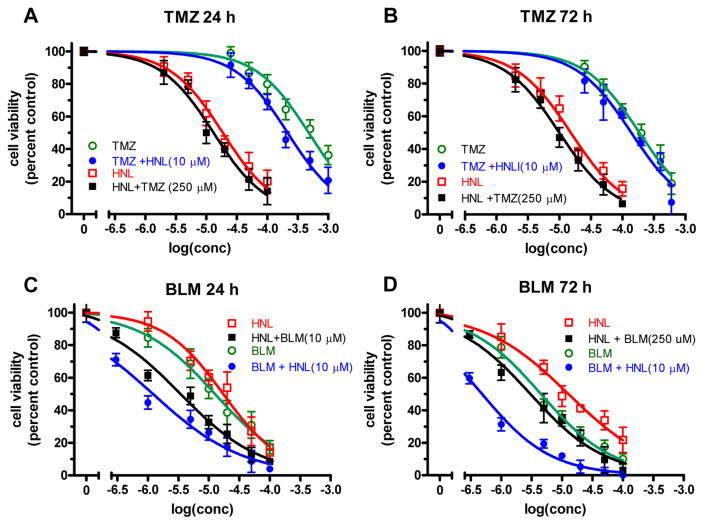
Figure 6.
Changes in EC50 due to combination of HNL with BLM and TMZ in PANC1 cells. The cell viability was determined at different concentrations of HNL, TMZ, or BLM alone (represented by the open symbols) and in combination (represented by solid symbols). The data are the mean ± SE of threee experiments.

