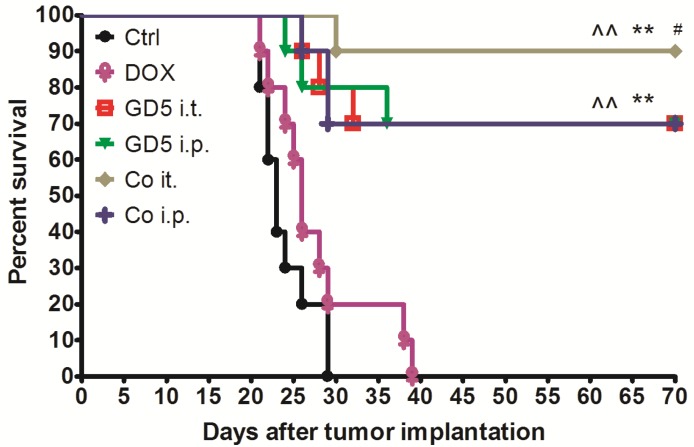
Figure 3.
Survival curve for tumor-bearing mice dosed as graphical representation. Tumor-bearing mice were treated as described in Figure 1. Tumor-bearing mice were randomly assigned to 6 groups, PBS, GD5 i.t., GD5 i.p., DOX i.t., Co i.t., or Co i.p treatment group. Each treatment group contained 10 mice and are representative of at least 2 independent experiments. ^^p < 0.01, compared with ctrl or DOX group; **p < 0.01, compared with GD5 i.t. or i.p. groups; #p < 0.05, compared with Co i.p., log-rank test.

