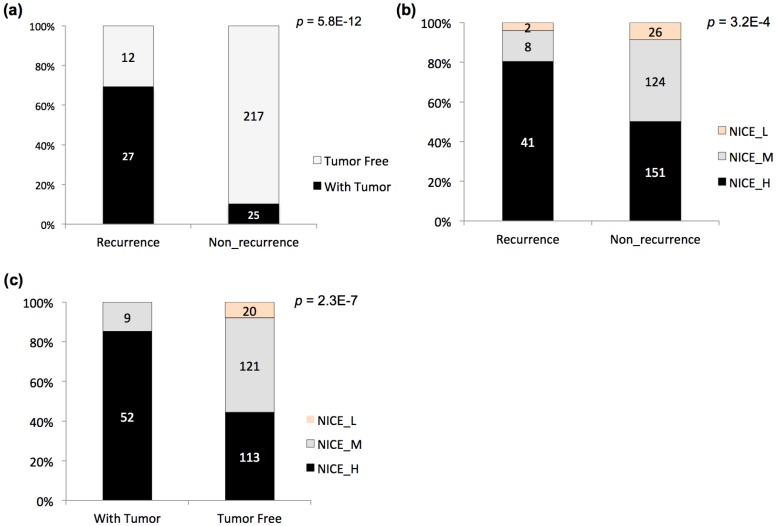
Figure 1.
Prognostic stratification of TCGA PCa cases. (a) Stratification of PCa cases based on biochemical recurrence status and tumor status at last follow-up and the relationship. (b) Stratification of PCa cases based on biochemical recurrence status and NICE criteria and the relationship. (c) Stratification of PCa cases tumor status at last follow-up and NICE criteria and the relationship. The accumulative bar diagrams were shown with the sum percentage of 100%. The number of cases for each subgroup was indicated. Chi-square tests were performed, with the p values indicated at the right upper corner.

