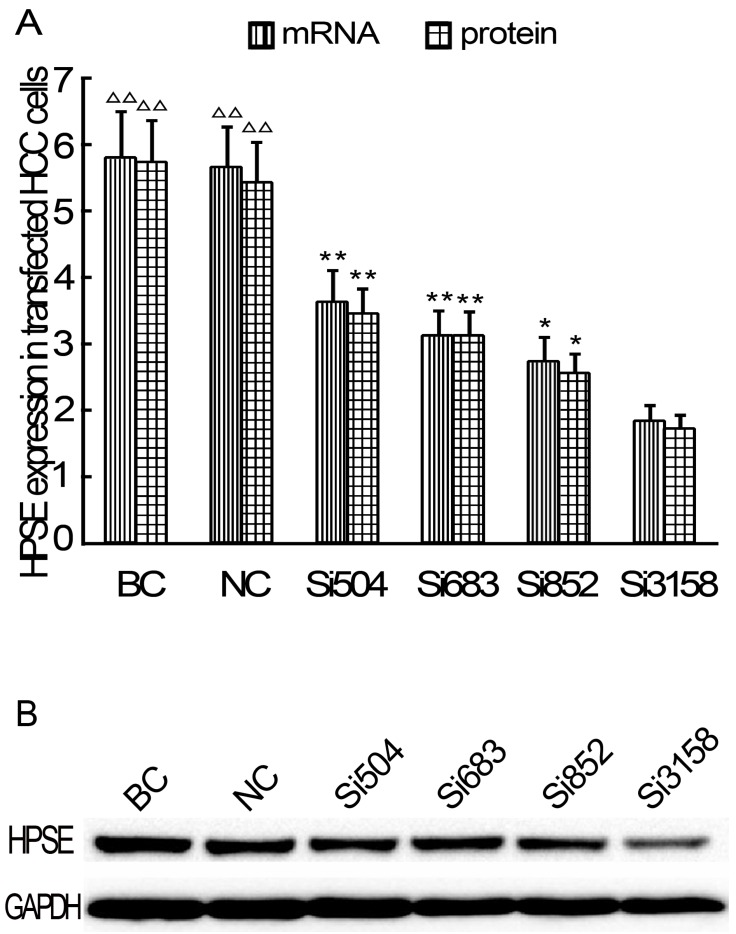
Figure 3.
Relative expression levels of HPSE in RNAi plasmids transfected HCCLM3 cells (Real-time qRT-PCR and western blot). A, HPSE mRNA and pritein expression levels. B Western blot. BC: Blank control group. NC: Negative control group. * P < 0.05, ** P < 0.01 vs si-3158 group. ∆∆ P < 0.01 vs siHPSE-504, siHPSE-683, siHPSE-852 and siHPSE-3158 groups.

