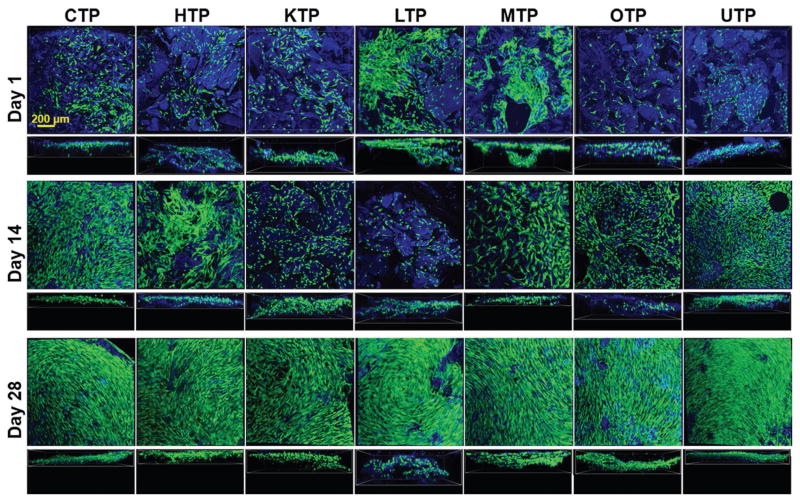
Figure 5.
hMSC culture on TPs. hMSC adheres, proliferates, and infiltrates TPs. For each row, the top figures represent surface images of the cells cultured on the different TPs and the bottom (smaller) figures show stacked images displaying cellular infiltration into the materials. All images are fluorescent confocal reconstructions of live–dead stained hMSCs on tissue papers at 1, 14, and 28 d after initial seeding. Green, red, and blue represent live cells, dead cells, and tissue papers (collagen autofluorescence), respectively.

